|
시장보고서
상품코드
1750600
세계의 전기자동차용 고출력 버스바 시장 : 기회, 성장 촉진요인, 산업 동향 분석 및 예측(2025-2034년)High Power Electric Vehicle Busbar Market Opportunity, Growth Drivers, Industry Trend Analysis, and Forecast 2025 - 2034 |
||||||
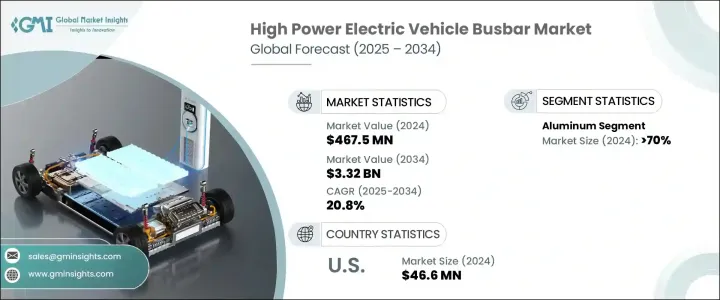
세계의 전기자동차용 고출력 버스바 시장은 2024년에는 4억 6,750만 달러로 평가되었고, 2034년에는 33억 2,000만 달러에 이를 것으로 전망됩니다.
여러 지역의 정부는 엄격한 배기 가스 규제를 시행하는 한편, 전기차의 생산 및 채택을 가속화하기 위한 인센티브를 제공하고 있습니다. 이러한 규제 모멘텀으로 인해 자동차 제조업체와 공급업체들은 첨단 전기차 아키텍처에 대한 투자를 확대하고 있으며, 버스바는 차량의 파워트레인 및 배터리 시스템 내에서 효율적인 에너지 전달에 중요한 역할을 하고 있습니다. 도시화 추세와 전기 이륜차, 배송 차량, 대중 교통 버스의 증가로 시장 범위가 확대되고 있습니다.

전기자동차용 고출력 버스바는 배터리 셀, 구동 장치 및 전자 제어 시스템 간의 전류를 관리하고 전달하는 데 필수적입니다. 이 부품의 성능은 EV의 효율성, 안전성 및 내구성에 직접적인 영향을 미칩니다. 재료의 혁신, 특히 알루미늄과 구리의 통합은 신뢰성과 전도성을 크게 향상시키고 있습니다. 구리는 우수한 열 안정성과 높은 전기 전도성으로 인해 주목을 받고 있으며, 첨단 EV 플랫폼에 이상적입니다.
| 시장 범위 | |
|---|---|
| 시작 연도 | 2024년 |
| 예측 연도 | 2025-2034년 |
| 시작 금액 | 4억 6,750만 달러 |
| 예측 금액 | 33억 2,000만 달러 |
| CAGR | 20.8% |
알루미늄 부문은 계속 전기자동차용 고출력 버스바 시장을 수량으로 선도하고 있으며, 그 유리한 중량, 전도성, 저렴한 가격으로 2024년에는 70%의 점유율을 차지했습니다. 자동차 제조사들이 에너지 효율성과 주행 거리 개선을 위해 경량 차량 설계를 우선시함에 따라, 알루미늄은 전기차 전력 분배 시스템의 대규모 적용에 가장 실용적인 재료로 부상하고 있습니다. 경량성 외에도 알루미늄은 특히 상업용 및 대량 생산 승용차 부문에서 현대의 전기자동차가 요구하는 성능을 충족할 수 있는 충분한 열전도율과 전기 전도율을 제공합니다.
미국의 전기자동차용 고출력 버스바 2024년 시장 규모는 4,660만 달러로 평가되었으며, 이는 전국적인 충전 인프라에 대한 대규모 투자와 탄소 배출량 감소를 목표로 한 정부 지원 인센티브에 힘입어 전기자동차 판매가 급증한 데 따른 것입니다. 고속 충전 시스템의 통합이 증가하고 장거리 EV에 대한 수요가 증가함에 따라 견고하고 대용량의 버스바 솔루션에 대한 필요성이 높아지고 있습니다. 북미가 더 깨끗한 교통 생태계로 전환함에 따라 첨단 전기 부품이 소비자 및 상용차 플랫폼에서 우선 순위가 되고 있습니다.
전기자동차용 고출력 버스바 시장을 형성하는 주요 기업은 Weidmuller Interface GmbH & Co.KG, Infineon Technologies AG, Rogers Corporation, EAE Group, Mersen SA, EMS Group, Siemens, Blar Elettromeccanica SpA, TE Connectivity, Amphenol Corporation, Mitsubishi Electric Inc., Legrand Electronics 등입니다. 이들 기업은 시장 지위를 강화하기 위해 다양한 전략적 접근 방식을 채택하고 있습니다. 주요 노력에는 생산 능력 확대, 전도성과 열 성능 개선을 위한 연구개발(R&D) 투자, 전기차 제조사와의 협력을 통한 통합 설계 솔루션 개발이 포함됩니다. 많은 기업들은 경량화 및 고효율 소재에 집중하며, 다양한 차량 부문에 적용 가능한 확장형 전기차 플랫폼을 지원하기 위해 모듈형 버스바 시스템 개발을 탐색하고 있습니다.
목차
제1장 조사 방법과 범위
제2장 주요 요약
제3장 업계 인사이트
- 생태계 분석
- 트럼프 정권의 관세 분석
- 무역에 미치는 영향
- 무역량의 혼란
- 보복 조치
- 업계에 미치는 영향
- 공급측의 영향(원자재)
- 주요 원자재의 가격 변동
- 공급망 재구성
- 생산 비용에 미치는 영향
- 수요측의 영향(판매가격)
- 최종 시장에의 가격 전달
- 시장 점유율 동향
- 소비자의 반응 패턴
- 공급측의 영향(원자재)
- 영향을 받는 주요 기업
- 전략적인 업계 대응
- 공급망 재구성
- 가격 설정 및 제품 전략
- 정책관여
- 전망과 향후 검토 사항
- 무역에 미치는 영향
- 규제 상황
- 업계에 미치는 영향요인
- 성장 촉진요인
- 업계의 잠재적 위험 및 과제
- 성장 가능성 분석
- Porter's Five Forces 분석
- PESTEL 분석
제4장 경쟁 구도, 2024년
- 소개
- 전략적 대시보드
- 전략적 노력
- 기업의 시장 점유율
- 경쟁 벤치마킹
- 혁신과 기술의 상황
제5장 시장 규모와 예측 : 재료별(2021-2034년)
- 주요 동향
- 구리
- 알루미늄
제6장 시장 규모와 예측 : 지역별(2021-2034년)
- 주요 동향
- 북미
- 미국
- 캐나다
- 유럽
- 노르웨이
- 독일
- 프랑스
- 네덜란드
- 영국
- 스웨덴
- 아시아태평양
- 중국
- 인도
- 일본
- 한국
- 싱가포르
- 중동 및 아프리카
- 사우디아라비아
- 아랍에미리트(UAE)
- 이스라엘
- 남아프리카
- 라틴아메리카
- 브라질
- 아르헨티나
제7장 기업 프로파일
- Amphenol Corporation
- Brar Elettromeccanica SpA
- EAE Group
- EG Electronics
- EMS Group
- Infineon Technologies AG
- Legrand
- Littelfuse, Inc.
- Mersen SA
- Mitsubishi Electric Corporation
- Rogers Corporation
- Schneider Electric
- Siemens
- TE Connectivity
- Weidmuller Interface GmbH &Co. KG
The Global High Power Electric Vehicle Busbar Market was valued at USD 467.5 million in 2024 and is estimated to grow at a CAGR of 20.8% to reach USD 3.32 billion by 2034, driven by the rising adoption of electric vehicles worldwide and the demand for efficient and durable power distribution components, especially high-performance EV busbars. Governments across regions are enforcing strict emission regulations while providing incentives to accelerate EV production and adoption. This regulatory momentum is pushing automakers and suppliers to invest in advanced electric vehicle architecture, with busbars playing a key role in efficient energy transfer within the vehicle's powertrain and battery systems. Urbanization trends and the rise of electric two-wheelers, delivery fleets, and public transit buses expand the market's reach.
High-power EV busbars are essential in managing and directing electric currents between battery cells, drive units, and electronic control systems. Their performance directly impacts the efficiency, safety, and durability of EVs. Innovations in materials-specifically the integration of aluminum and copper-are significantly boosting their reliability and conductivity. Copper is gaining traction due to its superior thermal stability and high electrical conductivity, making it ideal for advanced EV platforms.
| Market Scope | |
|---|---|
| Start Year | 2024 |
| Forecast Year | 2025-2034 |
| Start Value | $467.5 Million |
| Forecast Value | $3.32 Billion |
| CAGR | 20.8% |
The aluminum segment continues to lead the high-power EV busbar market in volume, accounting for a 70% share in 2024 attributed to its favorable weight, conductivity, and affordability. As automakers prioritize lightweight vehicle designs to improve energy efficiency and range, aluminum emerges as the most practical material for large-scale application in EV power distribution systems. Beyond just its lightness, aluminum offers sufficient thermal and electrical conductivity to meet the performance demands of modern electric vehicles, particularly in commercial and high-volume passenger segments.
United States High Power Electric Vehicle Busbar Market was valued at USD 46.6 million in 2024, driven by the surge in EV sales supported by expansive investments in nationwide charging infrastructure and government-backed incentives aimed at reducing carbon emissions. The increasing integration of fast-charging systems and the growing demand for extended-range EVs drive the need for robust and high-capacity busbar solutions. As North America shifts toward a cleaner transportation ecosystem, advanced electrical components are becoming a priority in consumer and commercial vehicle platforms.
Key players shaping the High Power Electric Vehicle Busbar Market include Weidmuller Interface GmbH & Co. KG, Infineon Technologies AG, Rogers Corporation, EAE Group, Mersen SA, EMS Group, Siemens, Brar Elettromeccanica SpA, TE Connectivity, Amphenol Corporation, Mitsubishi Electric Corporation, Legrand, Schneider Electric, Littelfuse Inc., and EG Electronics. These companies are adopting several strategic approaches to solidify their market position. Efforts include expanding production capabilities, investing in R&D to enhance conductivity and thermal performance, and collaborating with EV manufacturers for integrated design solutions. Many are focusing on lightweight, high-efficiency materials and exploring modular busbar systems to support scalable EV platforms across various vehicle segments.
Table of Contents
Chapter 1 Methodology & Scope
- 1.1 Market scope & definitions
- 1.2 Market estimates & forecast parameters
- 1.3 Forecast calculation
- 1.4 Data sources
- 1.4.1 Primary
- 1.4.2 Secondary
- 1.4.2.1 Paid
- 1.4.2.2 Public
Chapter 2 Executive Summary
- 2.1 Industry synopsis, 2021 - 2034
Chapter 3 Industry Insights
- 3.1 Industry ecosystem analysis
- 3.2 Trump administration tariffs analysis
- 3.2.1 Impact on trade
- 3.2.1.1 Trade volume disruptions
- 3.2.1.2 Retaliatory measures
- 3.2.2 Impact on the industry
- 3.2.2.1 Supply-side impact (raw materials)
- 3.2.2.1.1 Price volatility in key materials
- 3.2.2.1.2 Supply chain restructuring
- 3.2.2.1.3 Production cost implications
- 3.2.2.2 Demand-side impact (selling price)
- 3.2.2.2.1 Price transmission to end markets
- 3.2.2.2.2 Market share dynamics
- 3.2.2.2.3 Consumer response patterns
- 3.2.2.1 Supply-side impact (raw materials)
- 3.2.3 Key companies impacted
- 3.2.4 Strategic industry responses
- 3.2.4.1.1 Supply chain reconfiguration
- 3.2.4.1.2 Pricing and product strategies
- 3.2.4.1.3 Policy engagement
- 3.2.5 Outlook and future considerations
- 3.2.1 Impact on trade
- 3.3 Regulatory landscape
- 3.4 Industry impact forces
- 3.4.1 Growth drivers
- 3.4.2 Industry pitfalls & challenges
- 3.5 Growth potential analysis
- 3.6 Porter's analysis
- 3.6.1 Bargaining power of suppliers
- 3.6.2 Bargaining power of buyers
- 3.6.3 Threat of new entrants
- 3.6.4 Threat of substitutes
- 3.7 PESTEL analysis
Chapter 4 Competitive Landscape, 2024
- 4.1.1 Introduction
- 4.1.2 Strategic dashboard
- 4.1.3 Strategic initiative
- 4.1.4 Company market share
- 4.1.5 Competitive benchmarking
- 4.1.6 Innovation & technology landscape
Chapter 5 Market Size and Forecast, By Material, 2021 - 2034 (USD Million)
- 5.1 Key trends
- 5.2 Copper
- 5.3 Aluminum
Chapter 6 Market Size and Forecast, By Region, 2021 - 2034 (USD Million)
- 6.1 Key trends
- 6.2 North America
- 6.2.1 U.S.
- 6.2.2 Canada
- 6.3 Europe
- 6.3.1 Norway
- 6.3.2 Germany
- 6.3.3 France
- 6.3.4 Netherlands
- 6.3.5 UK
- 6.3.6 Sweden
- 6.4 Asia Pacific
- 6.4.1 China
- 6.4.2 India
- 6.4.3 Japan
- 6.4.4 South Korea
- 6.4.5 Singapore
- 6.5 Middle East & Africa
- 6.5.1 Saudi Arabia
- 6.5.2 UAE
- 6.5.3 Israel
- 6.5.4 South Africa
- 6.6 Latin America
- 6.6.1 Brazil
- 6.6.2 Argentina
Chapter 7 Company Profiles
- 7.1 Amphenol Corporation
- 7.2 Brar Elettromeccanica SpA
- 7.3 EAE Group
- 7.4 EG Electronics
- 7.5 EMS Group
- 7.6 Infineon Technologies AG
- 7.7 Legrand
- 7.8 Littelfuse, Inc.
- 7.9 Mersen SA
- 7.10 Mitsubishi Electric Corporation
- 7.11 Rogers Corporation
- 7.12 Schneider Electric
- 7.13 Siemens
- 7.14 TE Connectivity
- 7.15 Weidmuller Interface GmbH & Co. KG