|
시장보고서
상품코드
1750554
시멘트 폐열 회수 시스템 시장 : 시장 기회, 성장 촉진요인, 산업 동향 분석, 예측(2025-2034년)Cement Waste Heat Recovery System Market Opportunity, Growth Drivers, Industry Trend Analysis, and Forecast 2025 - 2034 |
||||||
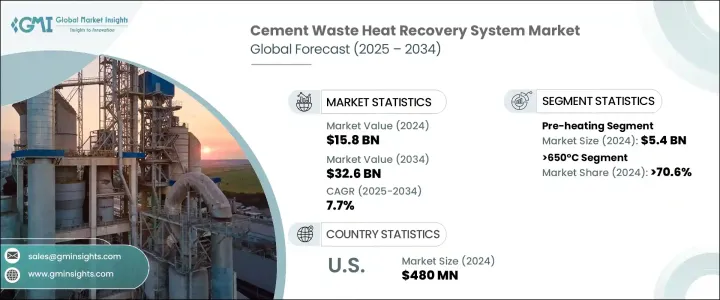
세계의 시멘트 폐열 회수 시스템 시장은 2024년에 158억 달러로 평가되었고, CAGR 7.7%로 성장할 전망이며, 2034년에는 326억 달러에 이를 것으로 추정됩니다.
시멘트 제조 공정은 가장 에너지 집약적인 산업 작업 중 하나이며 제조 중에 많은 양의 열이 발생하고 종종 손실됩니다. 폐열 회수 시스템은, 이 미사용의 열에너지를 회수해, 발전이나 프로세스 가열에 향해서 대폭적인 비용 삭감 및 외부 에너지원에의 의존도 저감을 실현하는 불가결한 솔루션으로서 대두해 오고 있습니다. 시멘트 업체들은 에너지 소비의 최적화, 배출의 최소화, 이익률의 향상이라는 압박에 계속 직면하고 있기 때문에 에너지 효율이 높은 시스템에 대한 수요는 꾸준히 증가하고 있습니다. 이러한 회수 솔루션은, 전체적인 지속 가능성 지표를 향상시키면서, 운전에 필요한 연료의 양을 삭감하는 것으로, 플랜트의 효율을 개선하는 데 중요한 역할을 하고 있습니다. 폐열 회수 시스템의 채용은, 중공업에 있어서의 보다 깨끗한 기술의 사용을 장려하는 환경 지령이나 규제 골조에 의해서 한층 더 뒷받침되고 있습니다.

폐열 회수 시스템은 시멘트 생산 공정의 여러 단계에 적용됩니다. 주요 용도 분야에는 예열, 발전, 증기 발생 및 기타 공정 강화가 포함됩니다. 이 중 예열 분야는 2024년 54억 달러를 차지했습니다. 이 분야에서는 킬른에 들어가기 전에 고온의 배기가스를 회수하여 원료를 가열합니다. 이 접근법을 사용하면 연료 소비를 크게 줄이고 생산 시간을 단축하며 운영 효율성을 높일 수 있습니다. 제조의 초기 단계에서 에너지 재사용을 최적화함으로써 제조업체는 생산 비용을 전반적으로 줄이면서 안정적인 생산량을 유지할 수 있습니다.
| 시장 범위 | |
|---|---|
| 시작 연도 | 2024년 |
| 예측 연도 | 2025-2034년 |
| 시작 금액 | 158억 달러 |
| 예측 금액 | 326억 달러 |
| CAGR | 7.7% |
온도 범주에서 시장은 230°C에서 작동하는 시스템, 230°C-650°C에서 작동하는 시스템, 650°C 이상의 시스템으로 구분됩니다. 2024년에는 650℃가 넘는 온도가 세계 시장의 70.6% 이상을 차지했으며, 최대 수익 점유율을 차지했습니다. 이러한 고온 시스템은 클링커 제조 단계에서 발생하는 극단적인 열 수준 때문에 시멘트 공장에 특히 효과적입니다. 한편 더 낮은 온도에서 작동하는 시스템은 일반적으로 재료의 예비 건조나 시설 내 주위 공간의 난방 등의 작업에 도입됩니다. 이러한 시스템은 고온 시스템과 동일한 수준의 에너지 회수를 제공하는 것은 아니지만 비교적 간단하고 예산 친화적이기 때문에 대규모 자본 지출을 하지 않고 에너지 비용 절감을 목표로 하는 소규모 시멘트 사업에 있어서는 실용적인 선택지가 됩니다.
북미에서는 미국에서 시멘트 폐열 회수 시스템의 채용이 꾸준히 증가하고 있습니다. 이 나라의 시장 평가액은, 2022년의 4억 4,000만 달러에서 2023년에는 4억 6,000만 달러로 성장했으며, 2024년에는 4억 8,000만 달러에 이르렀습니다. 시멘트 인프라의 노후화에 더해 이산화탄소 배출량의 삭감이 중시됨에 따라, 기업은 보다 에너지 효율이 높은 시스템으로의 업그레이드를 재촉하고 있습니다. 연방정부의 지원과 장려금도 열회수 기술의 구식 플랜트로의 통합을 촉진하는 데 중요한 역할을 하고 있습니다. 기업들이 에너지 컴플라이언스 요건을 충족하고 조업 생산량을 향상시키려 노력하는 가운데 선진적인 열에너지 회수 시스템의 채택은 증가 일로를 걷고 있습니다.
세계 시멘트 폐열 회수 시스템 시장은 적당히 통합되어 있으며 소수의 주요 기업이 업계 점유율의 대부분을 차지하고 있습니다. Siemens Energy, Mitsubishi Heavy Industries, Ltd., Thermax Limited 및 Kawasaki Heavy Industries Ltd 등 주요 기업은 2024년 시장 점유율의 약 30%를 차지했습니다. 이러한 기업은, 시멘트 킬른에서 발생하는 열을 이용 가능한 전기나 증기로 변환할 수 있는 고효율 시스템의 제공에 주력하고 있습니다. 이들 기업의 제품은 시멘트 생산자가 에너지 효율과 배출 감축 국제 기준을 충족하도록 지원하면서 에너지 낭비를 최소화하는 것을 돕습니다. 기술 혁신과 맞춤형 솔루션을 통해 이들 업체는 시멘트 산업에서 에너지 사용의 미래를 형성하는 데 도움이 되고 있습니다.
목차
제1장 조사 방법 및 범위
제2장 주요 요약
제3장 업계 인사이트
- 생태계 분석
- 트럼프 정권의 관세 분석
- 무역에 미치는 영향
- 무역량의 혼란
- 보복 조치
- 업계에 미치는 영향
- 공급측의 영향(원재료)
- 주요 원재료의 가격 변동
- 공급망 재구성
- 생산 비용에 미치는 영향
- 수요측의 영향(판매가격)
- 최종 시장에 대한 가격 전달
- 시장 점유율 동향
- 소비자의 반응 패턴
- 공급측의 영향(원재료)
- 영향을 받는 주요 기업
- 전략적인 업계 대응
- 공급망 재구성
- 가격 설정 및 제품 전략
- 정책관여
- 무역에 미치는 영향
- 전망 및 향후 검토 사항
- 업계에 미치는 영향요인
- 성장 가능성 분석
- Porter's Five Forces 분석
- PESTEL 분석
제4장 경쟁 구도
- 서문
- 기업의 시장 점유율
- 전략적 노력
- 경쟁 벤치마킹
- 전략적 대시보드
- 혁신 및 기술의 상황
제5장 시장 규모 및 예측 : 용도별(2021-2034년)
- 주요 동향
- 예열
- 전기 및 증기의 발전
- 증기 랭킨 사이클
- 유기 랭킨 사이클
- 카리나 사이클
- 기타
제6장 시장 규모 및 예측 : 온도별(2021-2034년)
- 주요 동향
- 230℃
- 230℃-650℃
- 650℃ 이상
제7장 시장 규모 및 예측 : 지역별(2021-2034년)
- 주요 동향
- 북미
- 미국
- 캐나다
- 멕시코
- 유럽
- 독일
- 영국
- 프랑스
- 이탈리아
- 스페인
- 아시아태평양
- 중국
- 호주
- 인도
- 일본
- 한국
- 중동 및 아프리카
- 사우디아라비아
- 아랍에미리트(UAE)
- 남아프리카
- 라틴아메리카
- 브라질
- 아르헨티나
제8장 기업 프로파일
- AURA
- Bosch Industriekessel GmbH
- Climeon
- CTP TEAM SRL
- Cochran
- Forbes Marshall
- IHI Corporation
- John Wood Group PLC
- Kawasaki Heavy Industries Ltd.
- MITSUBISHI HEAVY INDUSTRIES, LTD.
- Promec Engineering
- Sofinter Spa
- Siemens Energy
- Turboden SpA
- Thermax Limited
The Global Cement Waste Heat Recovery System Market was valued at USD 15.8 billion in 2024 and is estimated to grow at a CAGR of 7.7% to reach USD 32.6 billion by 2034. The cement manufacturing process is one of the most energy-intensive industrial operations, with massive quantities of heat generated and often lost during production. Waste heat recovery systems are emerging as an essential solution to capture this unused thermal energy and redirect it toward power generation or process heating, resulting in substantial cost savings and reduced reliance on external energy sources. As cement manufacturers continue to face pressure to optimize energy consumption, minimize emissions, and increase profit margins, the demand for energy-efficient systems is experiencing steady growth. These recovery solutions play a critical role in improving plant efficiency by reducing the amount of fuel needed for operations while enhancing overall sustainability metrics. Their adoption is being further boosted by environmental mandates and regulatory frameworks encouraging the use of cleaner technologies in heavy industries.
Waste heat recovery systems find application across several stages of the cement production process. Key application areas include pre-heating, electricity and steam generation, and other process enhancements. Among these, the pre-heating segment accounted for USD 5.4 billion in 2024. This segment involves recovering high-temperature exhaust gases to heat raw materials before they enter the kiln. Utilizing this approach significantly cuts down on fuel consumption, shortens production times, and improves operational efficiency. By optimizing energy reuse at earlier stages of production, manufacturers are able to maintain consistent output while trimming down overall production costs.
| Market Scope | |
|---|---|
| Start Year | 2024 |
| Forecast Year | 2025-2034 |
| Start Value | $15.8 Billion |
| Forecast Value | $32.6 Billion |
| CAGR | 7.7% |
In terms of temperature categories, the market is segmented into systems operating at 230°C, between 230°C and 650°C, and those above 650°C. The segment capturing temperatures greater than 650°C held the largest revenue share in 2024, accounting for more than 70.6% of the global market. These high-temperature systems are particularly effective for cement plants due to the extreme heat levels generated during the clinker production stage. Meanwhile, systems that operate at lower temperatures are generally implemented for tasks such as material pre-drying or ambient space heating within facilities. While they do not offer the same level of energy recapture as high-temperature systems, they are relatively simple and budget-friendly, making them a practical option for smaller-scale cement operations that still aim to reduce energy costs without undertaking large capital expenditures.
In North America, the United States has shown a steady increase in the adoption of cement waste heat recovery systems. Market valuation in the country grew from USD 440 million in 2022 to USD 460 million in 2023 and reached USD 480 million in 2024. A growing emphasis on reducing carbon emissions, along with aging cement infrastructure, is encouraging companies to upgrade to more energy-efficient systems. Federal support and incentives are also playing a vital role in driving the integration of heat recovery technologies into older plants. As companies strive to meet energy compliance requirements and enhance operational output, the adoption of advanced thermal energy recovery systems continues to rise.
The global cement waste heat recovery system market is moderately consolidated, with a few key players holding a significant portion of the industry share. Leading companies such as Siemens Energy, Mitsubishi Heavy Industries, Ltd., Thermax Limited, and Kawasaki Heavy Industries Ltd. collectively accounted for approximately 30% of the market share in 2024. These companies focus on delivering high-efficiency systems capable of converting heat generated from cement kilns into usable electricity or steam. Their offerings support cement producers in minimizing energy waste while helping them meet international standards for energy efficiency and emissions reduction. Through technological innovation and customized solutions, these manufacturers are instrumental in shaping the future of energy use in the cement industry.
Table of Contents
Chapter 1 Methodology & Scope
- 1.1 Research design
- 1.1.1 Research approach
- 1.1.2 Data Collection methods
- 1.2 Base estimates & calculations
- 1.2.1 Base year calculations
- 1.2.2 Key trends for market estimation
- 1.3 Forecast model
- 1.4 Primary research and validation
- 1.4.1 Primary sources
- 1.4.2 Data mining sources
- 1.5 Market definitions
Chapter 2 Executive Summary
- 2.1 Industry synopsis, 2021 - 2034
Chapter 3 Industry Insights
- 3.1 Industry ecosystem analysis
- 3.2 Trump administration tariffs analysis
- 3.2.1 Impact on trade
- 3.2.1.1 Trade volume disruptions
- 3.2.1.2 Retaliatory measures
- 3.2.2 Impact on the industry
- 3.2.2.1 Supply-side impact (raw materials)
- 3.2.2.1.1 Price volatility in key materials
- 3.2.2.1.2 Supply chain restructuring
- 3.2.2.1.3 Production cost implications
- 3.2.2.2 Demand-side impact (selling price)
- 3.2.2.2.1 Price transmission to end markets
- 3.2.2.2.2 Market share dynamics
- 3.2.2.2.3 Consumer response patterns
- 3.2.2.1 Supply-side impact (raw materials)
- 3.2.3 Key companies impacted
- 3.2.4 Strategic industry responses
- 3.2.4.1 Supply chain reconfiguration
- 3.2.4.2 Pricing and product strategies
- 3.2.4.3 Policy engagement
- 3.2.1 Impact on trade
- 3.3 Outlook and future considerations
- 3.4 Industry impact forces
- 3.5 Growth potential analysis
- 3.6 Porter's analysis
- 3.6.1 Bargaining power of suppliers
- 3.6.2 Bargaining power of buyers
- 3.6.3 Threat of new entrants
- 3.6.4 Threat of substitutes
- 3.7 PESTEL analysis
Chapter 4 Competitive landscape, 2024
- 4.1 Introduction
- 4.2 Company market share
- 4.3 Strategic initiative
- 4.4 Competitive benchmarking
- 4.5 Strategic dashboard
- 4.6 Innovation & technology landscape
Chapter 5 Market Size and Forecast, By Application, 2021 - 2034 (USD Billion)
- 5.1 Key trends
- 5.2 Pre-heating
- 5.3 Electricity & steam generation
- 5.3.1 Steam rankine cycle
- 5.3.2 Organic rankine cycle
- 5.3.3 Kalina cycle
- 5.4 Other
Chapter 6 Market Size and Forecast, By Temperature, 2021 - 2034 (USD Billion)
- 6.1 Key trends
- 6.2 230°C
- 6.3 230°C - 650 °C
- 6.4 > 650 °C
Chapter 7 Market Size and Forecast, By Region, 2021 - 2034 (USD Billion)
- 7.1 Key trends
- 7.2 North America
- 7.2.1 U.S.
- 7.2.2 Canada
- 7.2.3 Mexico
- 7.3 Europe
- 7.3.1 Germany
- 7.3.2 UK
- 7.3.3 France
- 7.3.4 Italy
- 7.3.5 Spain
- 7.4 Aisa Pacific
- 7.4.1 China
- 7.4.2 Australia
- 7.4.3 India
- 7.4.4 Japan
- 7.4.5 South Korea
- 7.5 Middle East & Africa
- 7.5.1 Saudi Arabia
- 7.5.2 UAE
- 7.5.3 South Africa
- 7.6 Latin America
- 7.6.1 Brazil
- 7.6.2 Argentina
Chapter 8 Company Profiles
- 8.1 AURA
- 8.2 Bosch Industriekessel GmbH
- 8.3 Climeon
- 8.4 CTP TEAM S.R.L
- 8.5 Cochran
- 8.6 Forbes Marshall
- 8.7 IHI Corporation
- 8.8 John Wood Group PLC
- 8.9 Kawasaki Heavy Industries Ltd.
- 8.10 MITSUBISHI HEAVY INDUSTRIES, LTD.
- 8.11 Promec Engineering
- 8.12 Sofinter S.p.a
- 8.13 Siemens Energy
- 8.14 Turboden S.p.A.
- 8.15 Thermax Limited