|
시장보고서
상품코드
1750550
석유 및 가스 폐수 회수 시스템 시장 : 시장 기회, 촉진요인, 산업 동향 분석, 예측(2025-2034년)Oil and Gas Wastewater Recovery Systems Market Opportunity, Growth Drivers, Industry Trend Analysis, and Forecast 2025 - 2034 |
||||||
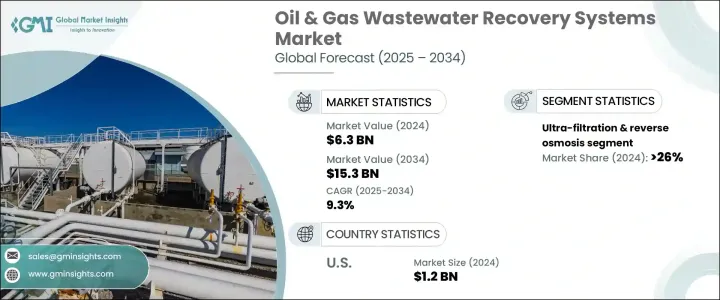
세계의 석유 및 가스 폐수 회수 시스템 시장은 2024년에는 63억 달러로 평가되었고, 특히 중동, 북미 일부, 남미, 남아시아 등의 물 부족 지역에서의 물 부족 문제의 심각화에 힘입어 CAGR 9.3%로 성장할 전망이며, 2034년에는 153억 달러에 달할 것으로 예측되고 있습니다.
담수가 점점 제한됨에 따라 석유 및 가스 등의 산업 부문에서 폐수를 재이용 및 회수할 필요성이 높아지고 있습니다. 규제로 인한 압력도 또 다른 주요 성장 요인입니다. 세계 각국의 정부는 폐기 전의 효과적인 폐수 처리를 요구하는 엄격한 환경 정책을 실시하고 있습니다. 이러한 시책은 워터 스튜어드십 및 규제 준수 중요성의 고조와 보조를 맞추어 기업에 고도의 회수 기술의 채용을 재촉하고 있습니다.

규제를 넘어 지속가능성은 사업 전략의 중심이 되고 있습니다. 석유 및 가스 생산자는 환경 영향을 최소화하고 ESG 성능을 강화하기 위해 회수 시스템에 적극적으로 투자하고 있습니다. CSR과 그린 이니셔티브를 비즈니스 모델에 포함시키는 것은, 장기적인 가치와 평판에 있어서 불가결이 되고 있습니다. 게다가 자동화와 스마트 여과 기술에 대한 주목은, 기업이 상류와 하류의 프로세스 전체에서 폐수 처리의 효율을 높이는 데 도움이 되고 있습니다. IoT 지원 센서, AI 탑재 감시 시스템, 자동 제어 플랫폼을 활용함으로써 기업은 실시간으로 처리 사이클을 최적화하고 수작업을 줄여 큰 문제로 발전하기 전에 이상을 검출할 수 있게 되었습니다. 이러한 지능형 솔루션은 수질의 변동에 따라 여과 매개 변수를 동적으로 조정할 수 있게 해 시스템의 응답성 및 에너지 효율을 높입니다.
| 시장 범위 | |
|---|---|
| 시작 연도 | 2024년 |
| 예측 연도 | 2025-2034년 |
| 시작 금액 | 63억 달러 |
| 예측 금액 | 153억 달러 |
| CAGR | 9.3% |
한외여과 및 역삼투막 부문은 미립자와 용존 오염물질을 제거하는 뛰어난 능력으로 2024년에 26%의 점유율을 차지했습니다. 활성탄 여과는 처리수에서 탄화수소, 색, 악취, 잔류유를 흡수하는 효과가 있기 때문에 계속해서 널리 채택되고 있습니다. 이러한 시스템은 수질 기준이 재사용이나 방류에 적합한지를 보장하기 위해 연마 단계에서 필수적입니다. 한외여과 및 역삼투막 기반 기술은 수압파쇄에서 발생하는 생산수나 역류수 처리에 유용합니다.
미국의 석유 및 가스 폐수 회수 시스템 시장은 2024년에 12억 달러를 창출했습니다. 엄격한 연방 규제, 물 인프라의 과제, 물 부족에 대한 의식의 고조가 북미에서의 채용을 뒷받침하고 있습니다. 생산 전략의 전환 및 유전 자산의 노후화가, 미국 시장 전체의 폐수 회수 기술에 대한 수요의 증가에 기여하고 있습니다.
석유 및 가스 폐수 회수 시스템 시장의 주요 기업은 기술 혁신, 합병, 제휴를 통해 적극적으로 포트폴리오를 확대하고 있습니다. Veolia, Evoqua Water Technologies, Pall Corporation, CLEARAS Water Recovery와 같은 기업들은 막 기반 여과, 모듈식 회수 유닛, AI 주도 모니터링 솔루션에 투자를 하고 있습니다. 유전 서비스 프로바이더와의 전략적 제휴에 의해, 처리 시스템의 현장 전개가 가능하게 되어, 수송 비용과 환경에의 영향이 삭감됩니다. 칼곤 카본이나 코발스 세퍼레이션 솔루션즈와 같은 기업은, 연구 개발 능력을 강화해, 프로세스 효율을 향상시키며, 다양한 물의 화학적 성질에 맞추어 처리 방법을 커스터마이징 하고 있습니다.
목차
제1장 조사 방법 및 범위
제2장 주요 요약
제3장 업계 인사이트
- 생태계 분석
- 트럼프 정권의 관세 분석
- 무역에 미치는 영향
- 무역량의 혼란
- 보복 조치
- 업계에 미치는 영향
- 공급측의 영향(원재료)
- 주요 원재료의 가격 변동
- 공급망 재구성
- 생산 비용에 미치는 영향
- 수요측의 영향(판매가격)
- 최종 시장에 대한 가격 전달
- 시장 점유율 동향
- 소비자의 반응 패턴
- 공급측의 영향(원재료)
- 영향을 받는 주요 기업
- 전략적인 업계 대응
- 공급망 재구성
- 가격 설정 및 제품 전략
- 정책관여
- 전망 및 향후 검토 사항
- 무역에 미치는 영향
- 규제 상황
- 업계에 미치는 영향요인
- 성장 촉진요인
- 업계의 잠재적 위험 및 과제
- 성장 가능성 분석
- Porter's Five Forces 분석
- PESTEL 분석
제4장 경쟁 구도
- 서문
- 전략적 대시보드
- 전략적 노력
- 기업의 시장 점유율
- 경쟁 벤치마킹
- 혁신 및 기술의 상황
제5장 시장 규모 및 예측 : 기술별(2021-2034년)
- 주요 동향
- 활성탄
- 한외여과 및 역삼투막
- 막 여과
- 이온 교환 수지 시스템
- 미디어 여과
- 기타
제6장 시장 규모 및 예측 : 지역별(2021-2034년)
- 주요 동향
- 북미
- 미국
- 캐나다
- 유럽
- 영국
- 독일
- 프랑스
- 스페인
- 이탈리아
- 폴란드
- 아시아태평양
- 중국
- 인도
- 일본
- 호주
- 말레이시아
- 인도네시아
- 중동 및 아프리카
- 사우디아라비아
- 아랍에미리트(UAE)
- 남아프리카
- 라틴아메리카
- 브라질
- 멕시코
- 아르헨티나
제7장 기업 프로파일
- BioChem Technology
- Calgon Carbon
- CLEARAS Water Recovery
- ClearBlu Environmental
- Dynatec Systems
- Encon Evaporators
- Evoqua Water Technologies
- Kemco Systems
- Kovalus Separation Solutions
- Kontek Ecology Systems
- Korte Environmental Technology
- Mech-Chem Associates
- Pall Corporation
- Veolia
- Westlake Vinnolit
The Global Oil and Gas Wastewater Recovery Systems Market was valued at USD 6.3 billion in 2024 and is estimated to grow at a CAGR of 9.3% to reach USD 15.3 billion by 2034, fueled by mounting water scarcity challenges, particularly in water-stressed regions such as the Middle East, parts of North America, and South Asia. As freshwater becomes increasingly limited, the need to recycle and recover wastewater in industrial sectors like oil and gas has become critical. Regulatory pressure is another key growth driver. Governments worldwide are enforcing strict environmental policies that demand effective wastewater treatment before disposal. These measures are pushing companies to adopt advanced recovery technologies, aligning with the rising emphasis on water stewardship and regulatory compliance.
Beyond regulation, sustainability is becoming central to operational strategies. Oil & gas producers are actively investing in recovery systems to minimize environmental impact and reinforce ESG performance. Integrating CSR and green initiatives into business models has become vital for long-term value and reputation. Additionally, the focus on automation and smart filtration technologies is helping firms boost efficiency in wastewater treatment across upstream and downstream processes. By leveraging IoT-enabled sensors, AI-powered monitoring systems, and automated control platforms, companies can now optimize treatment cycles in real-time, reduce manual intervention, and detect anomalies before they escalate into larger issues. These intelligent solutions allow for dynamic adjustment of filtration parameters based on water quality fluctuations, which enhances system responsiveness and energy efficiency.
| Market Scope | |
|---|---|
| Start Year | 2024 |
| Forecast Year | 2025-2034 |
| Start Value | $6.3 Billion |
| Forecast Value | $15.3 Billion |
| CAGR | 9.3% |
The ultra-filtration & reverse osmosis segment accounted for a 26% share in 2024 due to their superior ability to eliminate fine particulates and dissolved contaminants. Activated carbon filtration continues to be widely adopted for its effectiveness in absorbing hydrocarbons, color, odor, and residual oils from treated water. These systems are essential during the polishing phase to ensure water quality standards are met for reuse or discharge. Ultra-filtration & reverse osmosis membrane-based techniques are useful for treating produced and flowback water from hydraulic fracturing.
U.S. Oil & Gas Wastewater Recovery Systems Market generated USD 1.2 billion in 2024. Strict federal regulations, water infrastructure challenges, and heightened awareness of water scarcity have driven adoption in North America. Shifts in production strategies and aging oilfield assets contribute to increased demand for wastewater recovery technologies across the U.S. market.
Key players in the oil & gas wastewater recovery systems market are aggressively expanding their portfolios through technological innovation, mergers, and partnerships. Companies like Veolia, Evoqua Water Technologies, Pall Corporation, and CLEARAS Water Recovery are channeling investments into membrane-based filtration, modular recovery units, and AI-driven monitoring solutions. Strategic collaborations with oilfield service providers allow for on-site deployment of treatment systems, reducing transport costs and environmental impact. Firms like Calgon Carbon and Kovalus Separation Solutions strengthen their R&D capabilities to enhance process efficiency and customize treatment methods for different water chemistries.
Table of Contents
Chapter 1 Methodology & Scope
- 1.1 Market scope & definitions
- 1.2 Market estimates & forecast parameters
- 1.3 Forecast calculation
- 1.4 Data sources
- 1.4.1 Primary
- 1.4.2 Secondary
- 1.4.2.1 Paid
- 1.4.2.2 Public
Chapter 2 Executive Summary
- 2.1 Industry synopsis, 2021 - 2034
Chapter 3 Industry Insights
- 3.1 Industry ecosystem analysis
- 3.2 Trump administration tariffs analysis
- 3.2.1 Impact on trade
- 3.2.1.1 Trade volume disruptions
- 3.2.1.2 Retaliatory measures
- 3.2.2 Impact on the industry
- 3.2.2.1 Supply-side impact (raw materials)
- 3.2.2.1.1 Price volatility in key materials
- 3.2.2.1.2 Supply chain restructuring
- 3.2.2.1.3 Production cost implications
- 3.2.2.2 Demand-side impact (selling price)
- 3.2.2.2.1 Price transmission to end markets
- 3.2.2.2.2 Market share dynamics
- 3.2.2.2.3 Consumer response patterns
- 3.2.2.1 Supply-side impact (raw materials)
- 3.2.3 Key companies impacted
- 3.2.4 Strategic industry responses
- 3.2.4.1.1 Supply chain reconfiguration
- 3.2.4.1.2 Pricing and product strategies
- 3.2.4.1.3 Policy engagement
- 3.2.5 Outlook and future considerations
- 3.2.1 Impact on trade
- 3.3 Regulatory landscape
- 3.4 Industry impact forces
- 3.4.1 Growth drivers
- 3.4.2 Industry pitfalls & challenges
- 3.5 Growth potential analysis
- 3.6 Porter's analysis
- 3.6.1 Bargaining power of suppliers
- 3.6.2 Bargaining power of buyers
- 3.6.3 Threat of new entrants
- 3.6.4 Threat of substitutes
- 3.7 PESTEL analysis
Chapter 4 Competitive Landscape, 2025
- 4.1 Introduction
- 4.2 Strategic dashboard
- 4.3 Strategic initiative
- 4.4 Company market share
- 4.5 Competitive benchmarking
- 4.6 Innovation & technology landscape
Chapter 5 Market Size and Forecast, By Technology, 2021 - 2034 (USD Billion)
- 5.1 Key trends
- 5.2 Activated carbon
- 5.3 Ultra-filtration & reverse osmosis
- 5.4 Membrane filtration
- 5.5 Ion exchange resin systems
- 5.6 Media filtration
- 5.7 Others
Chapter 6 Market Size and Forecast, By Region, 2021 - 2034 (USD Billion)
- 6.1 Key trends
- 6.2 North America
- 6.2.1 U.S.
- 6.2.2 Canada
- 6.3 Europe
- 6.3.1 UK
- 6.3.2 Germany
- 6.3.3 France
- 6.3.4 Spain
- 6.3.5 Italy
- 6.3.6 Poland
- 6.4 Asia Pacific
- 6.4.1 China
- 6.4.2 India
- 6.4.3 Japan
- 6.4.4 Australia
- 6.4.5 Malaysia
- 6.4.6 Indonesia
- 6.5 Middle East & Africa
- 6.5.1 Saudi Arabia
- 6.5.2 UAE
- 6.5.3 South Africa
- 6.6 Latin America
- 6.6.1 Brazil
- 6.6.2 Mexico
- 6.6.3 Argentina
Chapter 7 Company Profiles
- 7.1 BioChem Technology
- 7.2 Calgon Carbon
- 7.3 CLEARAS Water Recovery
- 7.4 ClearBlu Environmental
- 7.5 Dynatec Systems
- 7.6 Encon Evaporators
- 7.7 Evoqua Water Technologies
- 7.8 Kemco Systems
- 7.9 Kovalus Separation Solutions
- 7.10 Kontek Ecology Systems
- 7.11 Korte Environmental Technology
- 7.12 Mech-Chem Associates
- 7.13 Pall Corporation
- 7.14 Veolia
- 7.15 Westlake Vinnolit